| 1 | 2 |
| 3 | 4 |
| FNAL | Fanny |
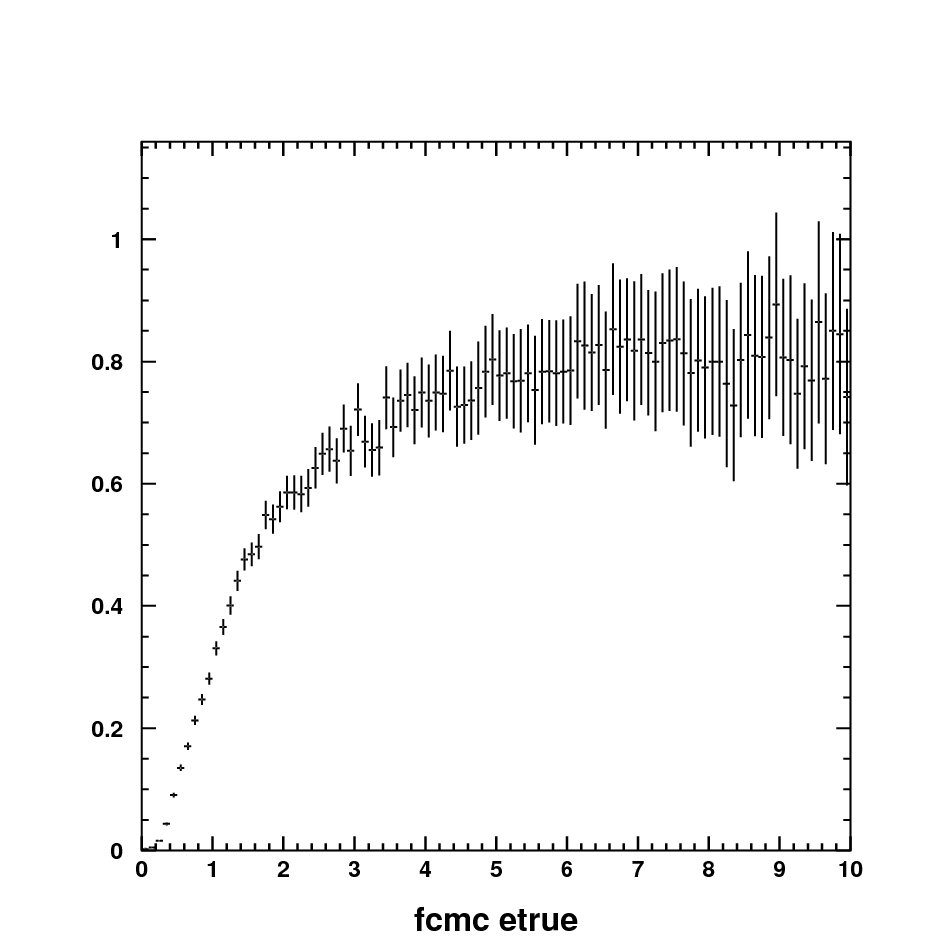
| Precuts (E true) chiaki_superk_eff.eps | Precuts (E true) (only for NC) and ALLMC/FCMC as explained before |
| Energy smearing ?? | Energy smearing matrix |
| Likelihood (E rec) chiaki_dlh_eff.eps | Likelihood (E rec) (Only for NC) |
| 1 | 2 |
| 3 | 4 |